 Telemetry and Metrics V2

We have been hard at work on the Transworld feedback items.
The first of those items we rolled out today is a huge revamp of our telemetry system and graphing tools.
We talked a little about this on the June State of the Lab live stream (you can watch the replay here 17:43 for the mention of telemetry), but we wanted to give you a more in-depth look at what has changed and what you can expect going forward.
So What Changed?
Before we can talk about what changed, we need to talk about what we had before. Our telemetry system was a bit of a mess and it was hard to get reliable data out of it. We had a lot of issues with data not being sent, data being sent multiple times, and data being sent out of order. This made it hard to trust the data and hard to make decisions based on it.
I want to stress that I don't believe telemetry is a "nice to have" feature/toy. I believe it is a "must have" feature. You can't improve what you can't measure and you can't measure what you can't see. We needed to fix this and we needed to fix it fast.
How Did It Work Before?
When an IgorBox is online, it would capture all the metrics onboard and every 60 seconds it would send a message to the server with all the metrics. This meant that the data wouldn't be real-time and the box needed to use its onboard (and limited) resources to save telemetry data and handle shipping that data on a schedule. Beyond that, if the IgorBox lost connection to the cloud servers, it caused all kinds of strange problems with the box and firmware.
How Does It Work Now?
We have completely re-architected the telemetry system to be more reliable, more real-time, and to completely remove the requirement on the IgorBox and its limited resources. The last thing is a huge win because the IgorBox can now focus on doing what it does best, controlling things!
When an IgorBox changes its state (ie: a relay turns on or off, a sensor value changes, etc), it sends a message to the server with that data. This notification is used to keep the cloud server up to date with the state of the IgorBox. This system was already in place, working well, and is just part of the firmware that runs the IgorBox peripherals. Basically, it is sending this notification data anyway so why not use it for telemetry? This means that the telemetry data is now real-time and we have some really cool plans for this aspect of the data in the future so stay tuned!
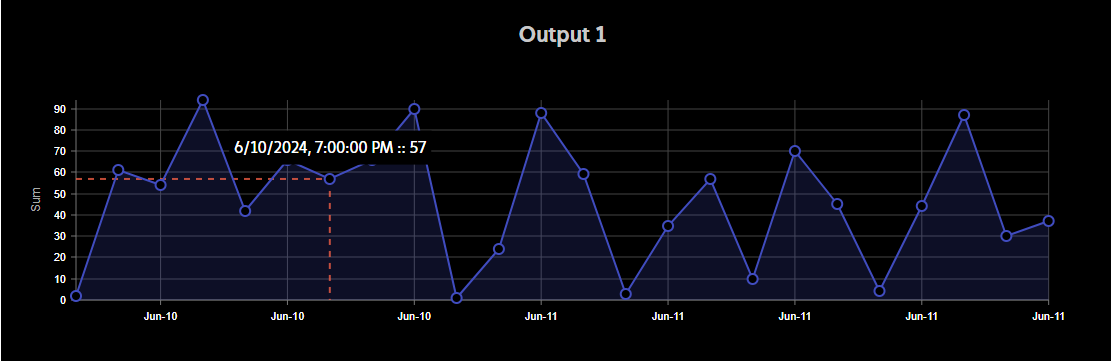
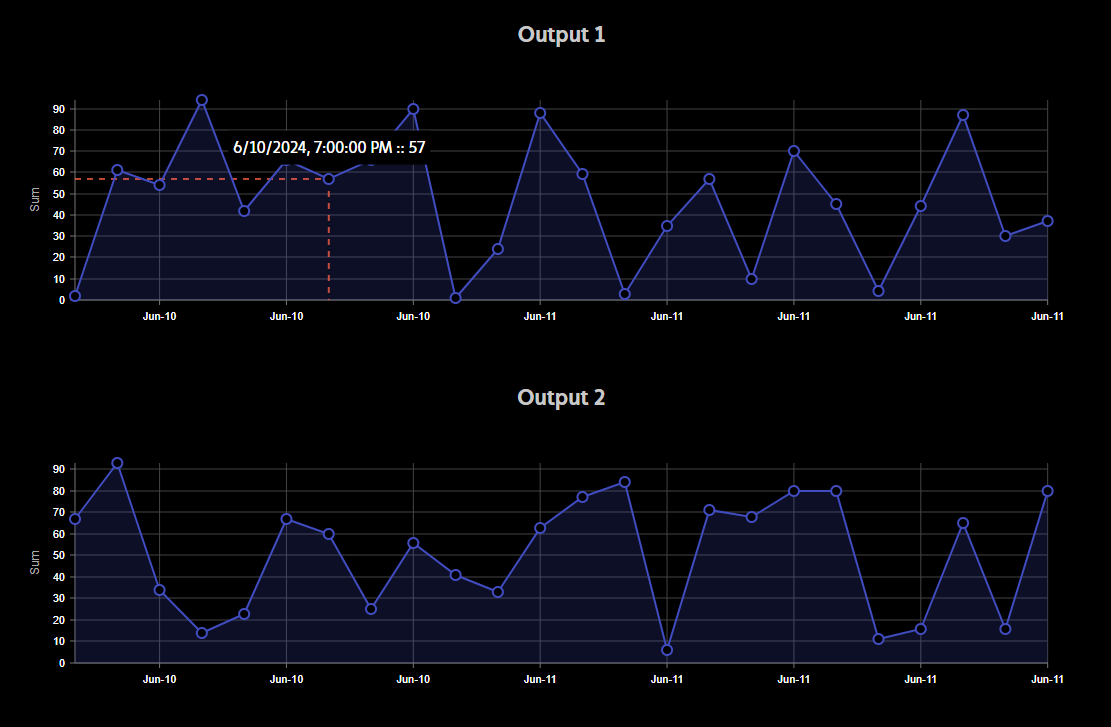
Anyway, the server receives this notification and a telemetry watcher receives the data and stores it in a time-series database in its raw form. So we are getting up to the millisecond data stored in a reliable way. We can then use this data to generate graphs, reports, and rollups. As an example you can see that we have rolled up a full day into a single graph with a sum for each hour or you can zoom in to see the data for a single minute!
What's Next?
We will continue to improve on this system and we have some really cool ideas for the future. We are also working on a way to allow you to export the data so you can use it in your own systems or just download the graph images for your own reports.
We know that many people are waiting for physical IgorBoxes to be available and are using the website in full simulator mode. We have accounted for that and have made it so that the simulator/virtual boxes on your account can create random data to simulate telemetry data. This means you can generate data and see how the telemetry data and graphs look without having to wait for a physical box to arrive.

Simulator boxes have this feature enabled by default and you can toggle it on or off in the box settings. If you toggle it off, it will get the real data generated by the simulator and show you that instead which is great for testing your graphs and reports.
The next thing we're working on is Organizations support. So watch for that in the coming weeks!